
GraphWaGu: GPU Powered Large Scale Graph Layout Computation and Rendering for the Web
WebGPUGraph Layout10+EGPGV 2022GraphWaGu:面向 Web 的 GPU 驱动大规模图布局计算与渲染
Abstract
Large scale graphs are used to encode data from a variety of application domains such as social networks, the web, biological networks, road maps, and finance. Computing enriching layouts and interactive rendering play an important role in many of these applications. However, producing an efficient and interactive visualization of large graphs remains a major challenge, particularly in the web-browser. Existing state of the art web-based visualization systems such as D3.js, Stardust, and NetV.js struggle to achieve interactive layout and visualization for large scale graphs. In this work, we leverage the latest WebGPU technology to develop GraphWaGu, the first WebGPU-based graph visualization system. WebGPU is a new graphics API that brings the full capabilities of modern GPUs to the web browser. Leveraging the computational capabilities of the GPU using this technology enables GraphWaGu to scale to larger graphs than existing technologies. GraphWaGu embodies both fast parallel rendering and layout creation using modified Frutcherman-Reingold and Barnes-Hut algorithms implemented in WebGPU compute shaders. Experimental results demonstrate that our solution achieves the best performance, scalability, and layout quality when compared to current state of the art web-based graph visualization libraries.
大规模图可用于编码来自多种应用领域的数据,例如社交网络、Web、生物网络、道路地图和金融。 在这些应用中,计算具有信息量的布局以及进行交互式渲染都非常重要。 然而,高效且交互式地可视化大图仍然是一项重大挑战,尤其是在 Web 浏览器中。 现有先进的 Web 可视化系统,例如 D3.js、Stardust 和 NetV.js,在大规模图的交互式布局和可视化方面仍然很吃力。 在本文中,作者利用最新的 WebGPU 技术开发了 GraphWaGu,这是第一个基于 WebGPU 的图可视化系统。 WebGPU 是一种新的图形 API,它把现代 GPU 的完整能力带到了 Web 浏览器中。 借助这项技术利用 GPU 的计算能力,使 GraphWaGu 能够比现有技术扩展到更大的图。 GraphWaGu 同时实现了快速并行渲染和布局生成,其中布局采用在 WebGPU compute shader 中实现的改进 Frutcherman-Reingold 与 Barnes-Hut 算法。 实验结果表明,与当前先进的 Web 图可视化库相比,作者的方法在性能、可扩展性和布局质量上都取得了最佳结果。
1. Introduction
A graph is used to represent connected entities and the relationships between them. Graphs are ubiquitous, appearing in many application domains, such as social networks, the web, the semantic web, road maps, communication networks, biology, and finance. It is common to process and analyze graphs for the purpose of extracting features such as connected components, cliques/triangles, and shortest paths. There are many production level graph mining and analytic systems to perform these kinds of tasks. Visualizing graphs where nodes and edges are mapped and projected to the 2D plane is another crucial task. There are many applications of graph visualization, including community detection, cluster analysis, and summarizing and understanding the overall structure of connected data. There are two aspects associated with visualizing a graph in 2D, layout creation (also referred to as graph drawing), where Cartesian coordinates are computed for every node of the graph, and rendering, where nodes and edges are rendered to an image based on the computed layout. In this paper, we limit the discussion of layout creation and rendering to undirected graphs.
图用于表示相互连接的实体以及它们之间的关系。 图无处不在,出现在许多应用领域中,例如社交网络、Web、语义 Web、道路地图、通信网络、生物学和金融。 人们通常会处理和分析图,以提取连通分量、团/三角形、最短路径等特征。 已有许多生产级图挖掘和图分析系统用于执行这类任务。 将节点和边映射并投影到二维平面来可视化图,是另一项关键任务。 图可视化有许多应用,包括社区检测、聚类分析,以及总结和理解连接数据的整体结构。 二维图可视化包含两个方面:布局生成,也称为图绘制,即为图中每个节点计算笛卡尔坐标;以及渲染,即根据计算出的布局把节点和边渲染成图像。 本文将布局生成和渲染的讨论限制在无向图上。
With the advent of big data and large scale applications leveraging HPC resources, we are observing graphs of increasing sizes, with millions of vertices and edges. Interactively visualizing such large scale graphs is challenging, as the massive number of nodes and edges poses a severe computational and rendering challenge. This problem is further exacerbated for web-based visualization systems. The web browser has become the preferred modality for data visualization, as it provides a standardized cross-platform environment through which applications can be deployed to users. Existing state of the art web based graph visualization libraries such as D3.js, Cytoscape.js, and Stardust struggle to achieve interactive rendering and layout creation for such large scale graphs.
随着大数据的发展,以及越来越多大规模应用利用 HPC 资源,人们正在面对规模不断增长的图,这些图包含数百万个顶点和边。 交互式地可视化这类大规模图很困难,因为海量节点和边会带来严峻的计算和渲染挑战。 对于基于 Web 的可视化系统,这一问题会进一步加剧。 Web 浏览器已经成为数据可视化的首选载体,因为它提供了标准化的跨平台环境,应用可以通过浏览器部署给用户。 现有先进的 Web 图可视化库,例如 D3.js、Cytoscape.js 和 Stardust,在这类大规模图的交互式渲染和布局生成方面仍然困难。
To deal with visualizing large graphs, existing state of the art graph mining and analytic systems perform concurrent parallel execution, leveraging either shared memory parallelism on GPUs or distributed parallelism through MPI. Existing web-based graph visualization libraries, however, have either been limited to serial execution on the CPU, as in D3.js, or have leveraged GPU capabilities for rendering only, as in Stardust.js. These limitations have caused existing web-based graph visualization systems to struggle with scaling to large graphs while maintaining interactivity. WebGPU is a new technology that enables addressing this limitation in the web browser. Compared to WebGL, the current standard for GPU rendering on the web which is used by Stardust and NetV.js to accelerate rendering, WebGPU provides a significant increase in GPU capabilities. Specifically, WebGPU provides compute shaders and storage buffers, which are essential for implementing computational algorithms on the GPU.
为了处理大图可视化,现有先进的图挖掘和图分析系统会进行并发并行执行,利用 GPU 上的共享内存并行性,或通过 MPI 利用分布式并行性。 然而,现有 Web 图可视化库要么受限于 CPU 上的串行执行,例如 D3.js;要么只把 GPU 能力用于渲染,例如 Stardust.js。 这些限制使得现有 Web 图可视化系统在扩展到大图并保持交互性方面十分困难。 WebGPU 是一项新技术,使得在 Web 浏览器中解决这一限制成为可能。 与当前 Web 上 GPU 渲染标准 WebGL 相比,WebGPU 显著增强了 GPU 能力;Stardust 和 NetV.js 正是使用 WebGL 来加速渲染。 具体来说,WebGPU 提供 compute shader 和 storage buffer,而这些能力对于在 GPU 上实现计算算法至关重要。
We have developed a web-based graph visualization library, GraphWaGu, that uses WebGPU to leverage the GPU’s computational power for layout creation and rendering for undirected graphs in 2 dimensions. By doing so, GraphWaGu is capable of visualizing large-scale networks at interactive frame rates. In particular, we make the following specific contributions: The first parallel and scalable WebGPU based graph rendering system, capable of rendering up to 100,000 nodes and 2,000,000 edges with interactive frame rates (≥ 10 FPS). The first parallel WebGPU based implementation of force directed layout computation using the Frutcherman-Reingold algorithm. An optimized parallel implementation for force directed layout computation using quadtree generation and traversal for Barnes-Hut simulation in WebGPU compute shaders (without recursion or use of pointers). Experimental studies to compare the performance and scalability of our WebGPU solutions against state of the art web-based graph visualization libraries. For 100,000 nodes and 2,000,000 edges, we maintain rendering frame rates 4× higher than the next best library (NetV.js) and layout creation times up to half that of D3.js.
作者开发了一个基于 Web 的图可视化库 GraphWaGu,它使用 WebGPU 来利用 GPU 的计算能力,在二维空间中为无向图进行布局生成和渲染。 因此,GraphWaGu 能够以交互式帧率可视化大规模网络。 具体而言,作者做出了以下具体贡献: 第一个并行且可扩展的基于 WebGPU 的图渲染系统,能够以交互式帧率(≥ 10 FPS)渲染多达 100,000 个节点和 2,000,000 条边。 第一个使用 Frutcherman-Reingold 算法、基于 WebGPU 的并行力导向布局计算实现。 一个用于力导向布局计算的优化并行实现,它在 WebGPU compute shader 中使用四叉树生成与遍历来进行 Barnes-Hut 模拟,并且不使用递归或指针。 将作者的 WebGPU 方案与先进 Web 图可视化库进行性能和可扩展性比较的实验研究。 对于 100,000 个节点和 2,000,000 条边,GraphWaGu 的渲染帧率比第二好的库 NetV.js 高 4 倍,布局生成时间最高可降至 D3.js 的一半。
2. Background and Related Work
In this section we cover relevant background work for both phases of graph visualization: graph layout creation and rendering. We then briefly discuss the key features of WebGPU that we leverage in GraphWaGu.
本节介绍图可视化两个阶段的相关背景工作:图布局生成与图渲染。 随后,作者简要讨论 GraphWaGu 中所利用的 WebGPU 关键特性。
2.1. Layout Creation
A graph
图
Pioneering work by Eades proposed the spring embedder algorithm to generate aesthetically pleasing layouts by treating undirected graphs as mechanical systems of steel balls and springs. The spring force acting between nodes attracts or repels them from each other depending on the distance between them, bringing change to the energy of system. The nodes are allowed to move from their initial placement due to these spring forces until a global minimum energy state is attained. There have been multiple further works such as the KK method and Frutherman and Reingold force directed algorithm to generate aesthetic graph layouts. The FR algorithm introduces a spring-electric model as a modification to the SE algorithm that imitates a physics simulation where vertices map to electrical particles and edges correspond to springs following Hook’s law. In this method, attractive forces are computed between adjacent nodes that pull them together, and repulsive forces are computed between every pair of non-adjacent nodes that repel them from each other. The algorithm defines an ideal length
Eades 的开创性工作提出了 spring embedder 算法,它把无向图看作钢球和弹簧组成的机械系统,以生成美观的布局。 节点之间的弹簧力会根据节点之间的距离吸引或排斥它们,从而改变系统能量。 在这些弹簧力作用下,节点可以从初始位置移动,直到达到全局最小能量状态。 随后又有许多工作用于生成美观的图布局,例如 KK 方法以及 Frutherman 和 Reingold 的力导向算法。 FR 算法引入了 spring-electric 模型,作为对 SE 算法的修改:它模拟一种物理过程,其中顶点对应电粒子,边对应遵循胡克定律的弹簧。 在该方法中,相邻节点之间计算吸引力,使它们被拉近;每一对非相邻节点之间计算排斥力,使它们彼此远离。 该算法定义一个理想长度
When the algorithm reaches a state of equilibrium or minimum energy, the layout computed tends to have edges of uniform length
当算法达到平衡状态或最小能量状态时,计算得到的布局通常具有长度接近
Prior work has also explored parallelizing graph layout creation. Brinkmann et al. parallelized the ForceAtlas2 algorithm, while Grama et al. and Burtscher and Pingali dealt with parallelizing the quadtree construction and traversal steps necessary for BH. There have also been efforts to improve performance by CPU parallelization, with Tikhonova and Ma using a pre-processing step and grouping of vertices. These works successfully improved the speed and scalability of force directed layout creation, but are limited to GPU programming frameworks like CUDA and OpenCL. We propose a unique parallel implementation of layout creation in the web written completely in the WebGPU shading language (WGSL).
已有工作也探索了图布局生成的并行化。 Brinkmann 等人并行化了 ForceAtlas2 算法,而 Grama 等人以及 Burtscher 和 Pingali 则处理了 BH 所需的四叉树构建与遍历步骤的并行化。 也有工作试图通过 CPU 并行化提升性能,例如 Tikhonova 和 Ma 使用预处理步骤并对顶点分组。 这些工作成功提升了力导向布局生成的速度和可扩展性,但它们受限于 CUDA 和 OpenCL 这类 GPU 编程框架。 作者提出了一种独特的 Web 并行布局生成实现,并且完全使用 WebGPU shading language(WGSL)编写。
2.2. Graph Rendering
Several visualization frameworks provide APIs to render graphs in the web, with some of the most popular being D3.js, Cytoscape.js, and Stardust. Most of these visualization frameworks use Canvas API or SVG to render, which are poor in terms of scalability and performance. The Canvas API performs better than SVG, but the ability of both to handle large-scale data with real time interaction is limited compared to GPU-accelerated technologies. This can be observed in Figure 3. The WebGL API is a more scalable and powerful alternative to Canvas API and SVG but requires users wanting visualizations to create their own rendering pipeline with shader code. In recent years though, new WebGL-based tools provide the necessary abstractions to perform easy rendering of large-scale graphs. Examples of such libraries are Stardust, Sigma.js, and NetV.js. Although WebGL based libraries like NetV.js promise good rendering ability, their overall performance is still limited by the limitations of WebGL, and they must rely on serial graph layout libraries like D3.js for graph generation.
多个可视化框架提供了在 Web 中渲染图的 API,其中最流行的包括 D3.js、Cytoscape.js 和 Stardust。 这些可视化框架大多使用 Canvas API 或 SVG 进行渲染,而它们在可扩展性和性能方面表现较弱。 Canvas API 的性能优于 SVG,但与 GPU 加速技术相比,两者处理大规模数据并保持实时交互的能力都有限。 这一点可以从 图3 中观察到。 WebGL API 是 Canvas API 和 SVG 更具可扩展性、更强大的替代方案,但想要进行可视化的用户需要用 shader 代码创建自己的渲染管线。 不过近年来,新的基于 WebGL 的工具提供了必要抽象,使大规模图的渲染更容易实现。 这类库包括 Stardust、Sigma.js 和 NetV.js。 虽然 NetV.js 这类基于 WebGL 的库承诺具备良好渲染能力,但其整体性能仍受 WebGL 限制,并且必须依赖 D3.js 这类串行图布局库来生成图布局。
2.3. WebGPU
WebGPU is a new graphics API that brings the full capabilities of modern GPUs to the web browser. WebGPU is built from the ground up, complete with its own shading language WGSL. In contrast to WebGL, WebGPU is not a port of an existing native API, though it is designed to easily map to modern APIs like DirectX12, Vulkan, and Metal for performance, and draws inspiration from them in its design. WebGPU provides a number of advantages over WebGL for developing complex compute and rendering applications in the browser. WebGPU enables rendering applications to construct a description of the rendering or compute pipeline state ahead of time, specifying the shaders, input and output data locations, and data layouts, to build a fixed description of the pipeline. Data are fed to the pipeline through bind groups, whose layouts similarly encode ahead of time the structure of the data to be provided to the pipeline, while allowing the buffers being read or written to be changed efficiently at execution time. The pre-configured state stored in the pipeline significantly reduces state configuration overhead costs incurred during execution, while still allowing flexibility as to what data buffers are read or written when the pipeline is executed. Furthermore, WebGPU supports compute shaders and storage buffers, providing unique support for developing GPU algorithms capable of processing large data sets in the browser. Prior work on deep neural networks and scientific visualization has leveraged the capabilities of WebGPU to deploy large-scale GPU parallel compute applications in the browser.
WebGPU 是一种新的图形 API,它把现代 GPU 的完整能力带到了 Web 浏览器中。 WebGPU 是从零开始构建的,并且配备了自己的 shading language WGSL。 与 WebGL 不同,WebGPU 并不是某个现有原生 API 的移植版本;不过为了性能,它被设计为能够轻松映射到 DirectX12、Vulkan 和 Metal 等现代 API,并且在设计上也借鉴了这些 API。 在浏览器中开发复杂的计算和渲染应用时,WebGPU 相比 WebGL 具有许多优势。 WebGPU 允许渲染应用提前构造渲染或计算管线状态的描述,包括指定 shader、输入输出数据位置和数据布局,从而构建固定的管线描述。 数据通过 bind group 输入管线,其 layout 同样会提前编码将提供给管线的数据结构,同时允许在执行时高效改变被读取或写入的 buffer。 管线中保存的预配置状态显著降低了执行期间产生的状态配置开销,同时仍然允许在执行管线时灵活选择读取或写入哪些数据 buffer。 此外,WebGPU 支持 compute shader 和 storage buffer,为在浏览器中开发能够处理大规模数据集的 GPU 算法提供了独特支持。 已有关于深度神经网络和科学可视化的工作利用 WebGPU 能力,在浏览器中部署大规模 GPU 并行计算应用。
3. Implementation
We implement rendering and force-directed layout techniques in our tool, GraphWaGu, a web-based GPU-accelerated library for interacting with large-scale graphs. GraphWaGu utilizes WebGPU to create visualizations from input graphs onto mouse-interactive HTML Canvas elements. GraphWaGu also presents GPU implementations of Fruchterman-Reingold and Barnes-Hut approximate force-directed layout algorithms using WebGPU compute shaders. Together, these features establish a user-friendly prototype for computing, evaluating, and recomputing graph layouts on the web. We structure this section by first discussing the graph rendering in order to introduce how GraphWaGu handles redrawing the changing of node positions that comes with interactivity and force directed layout iteration, then propose our algorithms for computing layouts with and without BH approximation.
作者在 GraphWaGu 中实现了渲染和力导向布局技术;GraphWaGu 是一个基于 Web 的 GPU 加速库,用于与大规模图交互。 GraphWaGu 利用 WebGPU,把输入图可视化到支持鼠标交互的 HTML Canvas 元素上。 GraphWaGu 还使用 WebGPU compute shader,实现了 Fruchterman-Reingold 与 Barnes-Hut 近似力导向布局算法的 GPU 版本。 这些特性共同构成了一个用户友好的原型,可以在 Web 上计算、评估并重新计算图布局。 本节首先讨论图渲染,以介绍 GraphWaGu 如何处理交互和力导向布局迭代中节点位置变化导致的重绘;随后提出在有无 BH 近似时计算布局的算法。
3.1. Graph Rendering
The GraphWaGu approach to graph rendering is built to take advantage of the unique features of WebGPU for web-based graphics using bind groups and large storage buffers. At system initialization, we create rendering pipelines for nodes and edges, with bind groups containing edge and node storage buffers, and then start an animation frame to continuously run these pipelines’ render passes. The edge buffer consists of
GraphWaGu 的图渲染方法利用了 WebGPU 在 Web 图形方面的独特特性,尤其是 bind group 和大 storage buffer。 在系统初始化时,作者为节点和边创建渲染管线,其中 bind group 包含边和节点的 storage buffer;随后启动 animation frame,持续运行这些管线的 render pass。 边 buffer 由
For both pipelines, vertex buffers of one element are used to describe the type of primitive to be drawn; for edges a line and for nodes two triangles in the form of a square. A draw call is made to instance
对于两个管线,作者都使用只有一个元素的 vertex buffer 来描述要绘制的 primitive 类型:边对应一条线,节点对应构成正方形的两个三角形。 一次 draw call 会实例化
3.2. Graph Layout Computation
We present algorithms GraphWaGu FR and GraphWaGu BH for Frutcherman-Reingold and Barnes-Hut approximate force directed layouts respectively. Iterations of the algorithms are computed and applied to nodes using WebGPU compute passes. These compute passes are run parallel to the render passes of the GraphWaGu animation frame, so that as new node positions are computed and applied, a new graph is rendered.
作者分别提出 GraphWaGu FR 和 GraphWaGu BH,用于 Frutcherman-Reingold 与 Barnes-Hut 近似力导向布局。 算法的迭代通过 WebGPU compute pass 计算,并应用到节点上。 这些 compute pass 与 GraphWaGu animation frame 的 render pass 并行运行,因此当新的节点位置被计算并应用时,新的图也会被渲染出来。
3.2.1. WebGPU Frutcherman-Reingold
Before running the GraphWaGu FR algorithm, we initialize the compute pipelines needed: adjacency matrix creation, force calculation, and force application with their respective compute shaders and necessary bind group layouts. An overview of the general algorithm used in WebGPU Frutcherman-Reingold is detailed in Algorithm 1. It follows closely to the original force directed algorithm proposed by Frutcherman and Reingold, apart from the use of an adjacency matrix and parallel computation of forces.
在运行 GraphWaGu FR 算法之前,作者会初始化所需的 compute pipeline:邻接矩阵创建、力计算、力应用,以及它们各自的 compute shader 和必要的 bind group layout。 WebGPU Frutcherman-Reingold 所使用的一般算法概述见算法 1。 除使用邻接矩阵和并行计算力之外,它与 Frutcherman 和 Reingold 提出的原始力导向算法高度相似。
- Input: G(V,E), coolingFactor
- for e in E do
- adjacencyMatrix[e.source + e.target * |V|] = 1
- adjacencyMatrix[e.target + e.source * |V|] = 1
- end for
- while coolingFactor ≥ ε do
- for i ← 0 to |V| do in parallel
- f = 0
- v = V[invocationId]
- for i ← 0 to |V| do
- if adjacencyMatrix[invocationId + i * |V|] then f ← f + fa(v,V[i])
- else f ← f + fr(v,V[i])
- end if
- end for
- F[invocationID] = f / |f| * min(coolingFactor, |f|)
- end for
- for i ← 0 to |V| do in parallel
- V[i].position ← V[i].position + F[i]
- end for
- coolingFactor ← coolingFactor * initialCoolingFactor
- end while
An adjacency matrix
图
Force computation is shown in lines 7-18 of Algorithm 1, where either repulsive or attractive forces are calculated for each vertex to each other vertex using the adjacency matrix, and application is shown in lines 19-21. We parallelize the FR force directed algorithm by dispatching one GPU thread per node, effectively running a parallel for loop over the node buffer and computing or applying forces for each. This method runs into issues when
力计算如算法 1 的第 7-18 行所示,其中使用邻接矩阵为每个顶点相对于其他每个顶点计算排斥力或吸引力;力的应用如第 19-21 行所示。 作者通过为每个节点分派一个 GPU 线程来并行化 FR 力导向算法,这实际上是在节点 buffer 上运行一个并行 for 循环,并为每个节点计算或应用力。 当
3.2.2. WebGPU Barnes-Hut
- Input: G(V,E), coolingFactor
- createSortedEdgeLists()
- while coolingFactor ≥ ε do
- createQuadTree()
- for v ← 0 to |V| do in parallel
- for e(i,j) in E with i or j = v do
- F[v] ← F[v] + fa(V[i], V[j])
- end for
- end for
- computeRepulsiveForces()
- for i ← 0 to |V| do in parallel
- V[i].position ← V[i].position + F[i]
- F[i] ← 0
- end for
- coolingFactor ← coolingFactor * initialCoolingFactor
- end while
The Barnes-Hut approximation algorithm has multiple challenges to be effectively implemented in parallel systems. The Barnes-Hut algorithm involves building and traversing a quadtree data structure, two tasks typically implemented through recursion, with nodes having pointers to their children, and dynamic allocation storage in a heap to hold the tree. Recursion, pointers, and dynamic allocation at runtime are not supported in programming compute shaders in WebGPU. We present our own methods of building and traversing a quadtree in compute passes on the GPU compatible with the WebGPU API.
Barnes-Hut 近似算法要在并行系统中有效实现,会遇到多个挑战。 Barnes-Hut 算法涉及四叉树数据结构的构建和遍历,而这两个任务通常通过递归实现,节点包含指向子节点的指针,并且需要在堆上动态分配存储来保存树。 WebGPU 的 compute shader 编程并不支持递归、指针以及运行时动态分配。 作者提出了自己的四叉树构建与遍历方法,它在 GPU 的 compute pass 中运行,并兼容 WebGPU API。
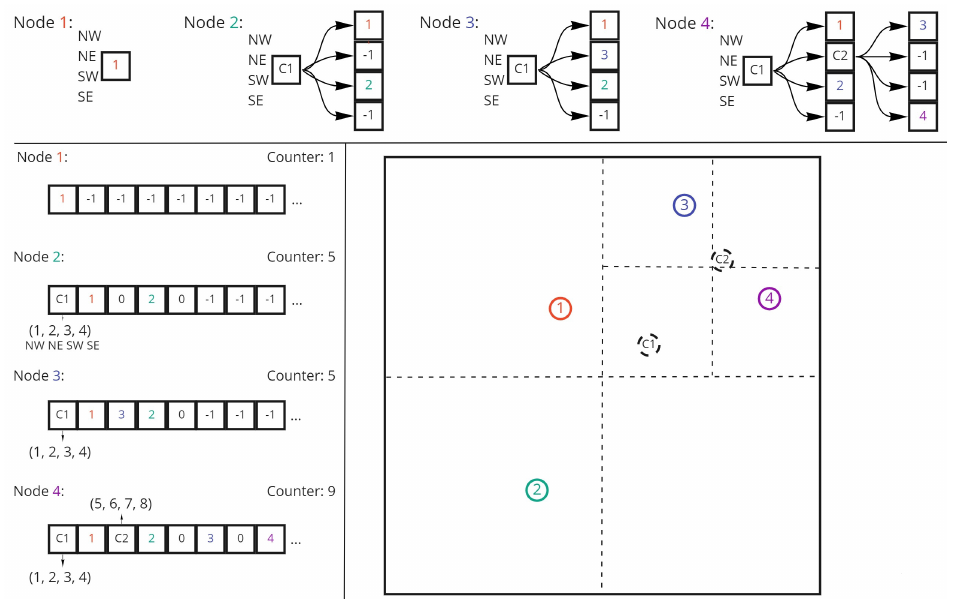
Our quadtree implementation utilizes one of the two approaches described by Samet for pointerless representations, treating the quadtree as a collection of its leaf nodes, with directional codes for indexes of its northwest, northeast, southwest, and southeast children. From the same source, we can also obtain the weak upper bound of
作者的四叉树实现使用了 Samet 描述的两种无指针表示方法之一:把四叉树视为叶节点集合,并用方向编码表示其西北、东北、西南、东南子节点在 buffer 中的索引。 同一来源还给出了
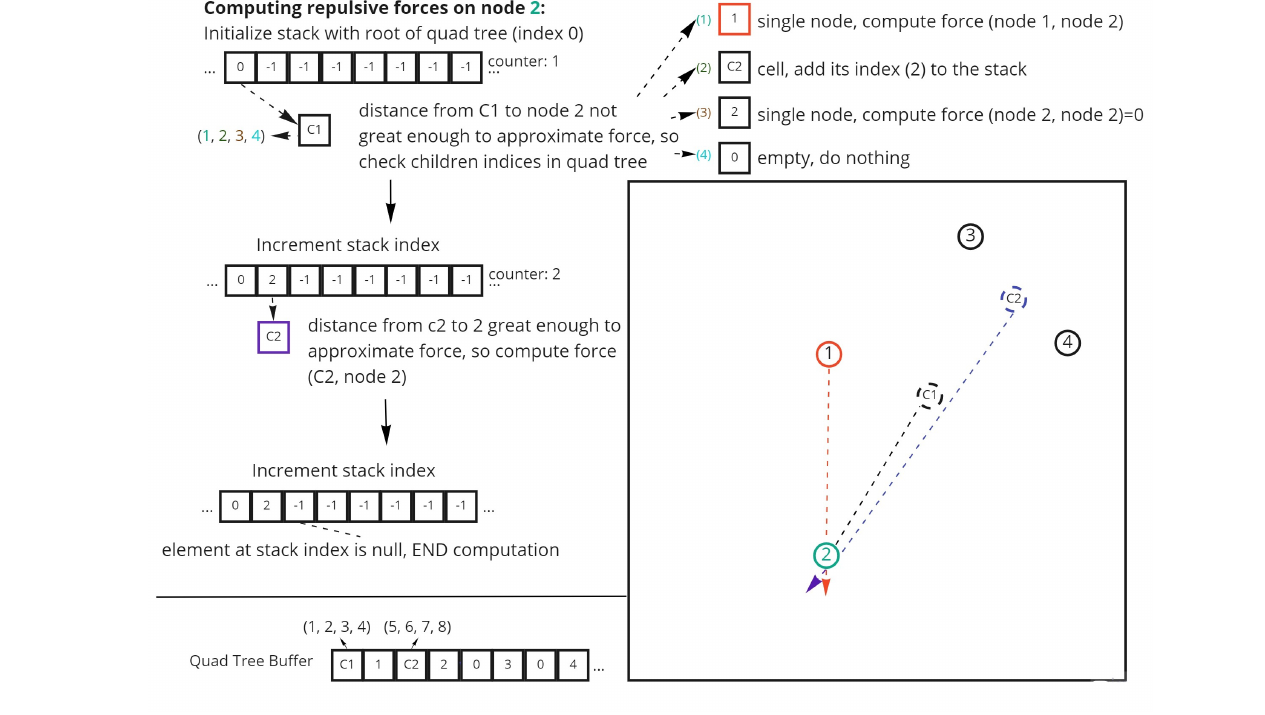
Once the quadtree is created, attractive and repulsive forces are computed in their own compute pipelines before being applied in the same way as GraphWaGu FR. An overview of the full GraphWaGu BH algorithm is given in Algorithm 2. Attractive forces in this algorithm now have to be computed in
四叉树创建完成后,吸引力和排斥力会先在各自的 compute pipeline 中计算,然后以与 GraphWaGu FR 相同的方式应用。 完整的 GraphWaGu BH 算法概述见算法 2。 由于没有构建邻接矩阵,且排斥力和吸引力必须在不同 pass 中计算,该算法中的吸引力现在需要以
4. Evaluation
To evaluate the performance of GraphWaGu, we performed three different sets of experiments comparing our solution with state-of-the-art techniques. In particular, we report: rendering benchmark using synthetic graphs at different scales; layout generation benchmark using synthetic graphs at different scales; and layout creation and rendering of a variety of real graphs.
为了评估 GraphWaGu 的性能,作者进行了三组不同实验,将其方案与先进技术进行比较。 具体而言,作者报告了三类结果:在不同规模合成图上的渲染 benchmark;在不同规模合成图上的布局生成 benchmark;以及多种真实图上的布局生成与渲染。
4.1. Experimental Setup
We ran all experiments on two different system setups with browser Google Chrome Canary: one equipped with AMD Ryzen 4600 CPU, 8GB RAM memory and integrated AMD Radeon C7 GPU; and one equipped with AMD Ryzen 5600 CPU, 16GB RAM memory and a dedicated NVIDIA GeForce RTX 2060 GPU. All the code for the application running the node rendering and layout creation pipelines is written in React, compiled with babel transcompiler, and bundled with webpack module bundler. For both the rendering and layout computation benchmarks, we generated 11 graphs with varying vertex counts, all with completely random edge connectivity and initial node positions using the javascript Math.random function. For these artificial graphs, we maintained an edge to vertex count ratio of 20 to model real-world data. The total vertex count for each graph varies from
作者在两个不同系统配置上使用 Google Chrome Canary 浏览器运行所有实验:一个系统配备 AMD Ryzen 4600 CPU、8GB RAM 和集成 AMD Radeon C7 GPU;另一个系统配备 AMD Ryzen 5600 CPU、16GB RAM 和独立 NVIDIA GeForce RTX 2060 GPU。 运行节点渲染与布局生成管线的应用代码全部使用 React 编写,由 babel transcompiler 编译,并通过 webpack module bundler 打包。 对于渲染和布局计算 benchmark,作者生成了 11 个顶点数量不同的图,所有图都使用 JavaScript 的 Math.random 函数生成完全随机的边连接和初始节点位置。 对于这些人工图,作者保持边数与顶点数比例为 20,以模拟真实世界数据。 每个图的总顶点数从
4.2. Graph Rendering Benchmark
We compare the rendering performance of GraphWaGu with other popular web-based graph rendering frameworks: NetV.js, D3.js, G6.js, Cytoscape, Sigma.js, and Stardust. Among these frameworks, D3.js is the most popular due to its robust catalogue of visualization options and built-in libraries for algorithms such as computing force directed graph layouts. However, due to its dependency on the DOM tree and SVG, D3.js cannot effectively handle a large number of graphical marks, especially when running animation. The frameworks NetV.js, Sigma.js, and Stardust are built on top of WebGL, and can therefore utilize the GPU for high performance rendering; however, they do not accelerate graph layout computation. G6.js does not leverage the GPU for rendering nor computation, and has limited scalability for large scale graph rendering as a result.
作者将 GraphWaGu 的渲染性能与其他流行 Web 图渲染框架进行比较,包括 NetV.js、D3.js、G6.js、Cytoscape、Sigma.js 和 Stardust。 在这些框架中,D3.js 最流行,因为它拥有强大的可视化选项目录,并内置了诸如力导向图布局计算等算法库。 然而,由于依赖 DOM tree 和 SVG,D3.js 无法有效处理大量图形标记,尤其是在运行动画时。 NetV.js、Sigma.js 和 Stardust 构建在 WebGL 之上,因此能够利用 GPU 进行高性能渲染;不过它们不会加速图布局计算。 G6.js 既没有利用 GPU 进行渲染,也没有利用 GPU 进行计算,因此在大规模图渲染中的可扩展性有限。
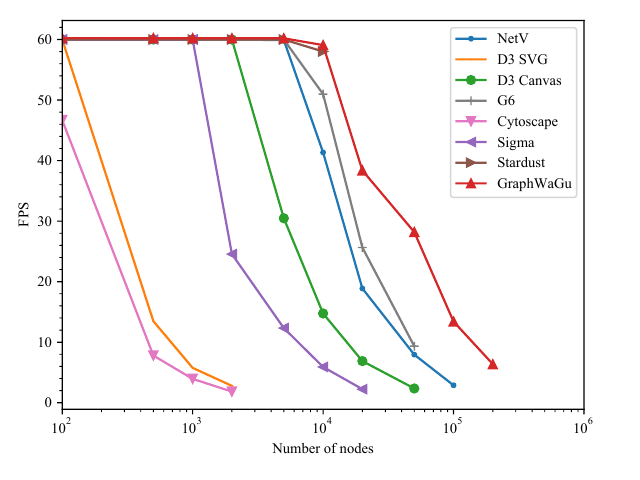
In order to properly stress test the abilities of the rendering libraries chosen, we one-by-one call each to render a completely different graph of the size being tested each frame. We randomly generate the graphs for each frame as detailed in the experimental setup, and do not include graph generation time in the time it takes to complete a frame. Frames per second is calculated for each library after repeating this process for a total duration of five seconds for each graph size. The FPS is then averaged over this five seconds, and this is what we record, capped at 60 FPS since it is the maximum display frequency. We report these FPS results for all libraries on both the dedicated and integrated GPUs in Figure 3 and Figure 4 respectively.
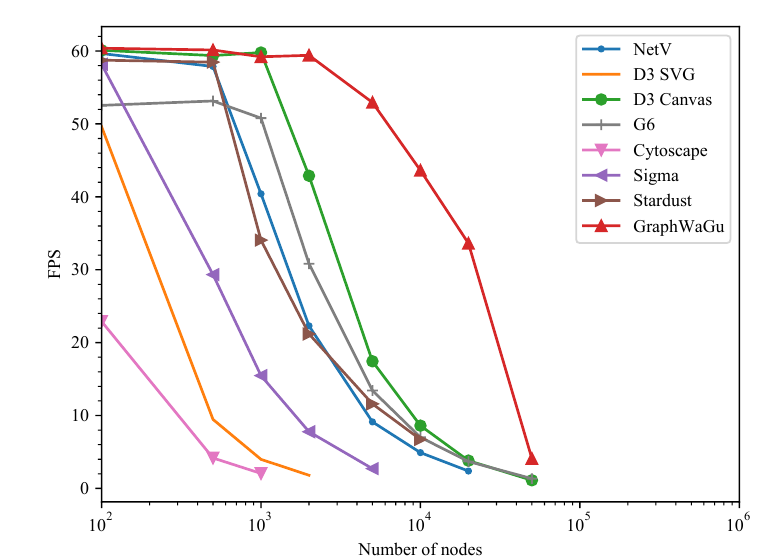
为了充分压力测试所选渲染库的能力,作者逐一调用每个库,在每一帧渲染一个完全不同的、具有测试规模的图。 作者按照实验设置中描述的方法为每帧随机生成图,并且不把图生成时间计入完成一帧所需的时间。 对于每种图规模,该过程总共重复五秒,并据此计算每个库的每秒帧数。 随后作者对这五秒内的 FPS 取平均并记录;由于显示频率上限为 60 FPS,因此记录值被截断在 60 FPS。 作者分别在 图3 和 图4 中报告了所有库在独立 GPU 与集成 GPU 上的 FPS 结果。
On both systems, GraphWaGu outperforms other frameworks and is the most scalable solution. The rendering performance of GraphWaGu is significantly better for the largest scale graphs even when using an integrated GPU, as shown in Figure 4. On the integrated GPU, WebGL based libraries performed similarly to optimized serial libraries up to the highest number of nodes, as there was not much GPU power for them to take advantage of. On the dedicated GPU, WebGL based libraries perform much better, with Stardust maintaining about equal FPS to GraphWaGu until passing 10,000 nodes and 200,000 edges, which is the limit of Stardust graph rendering. For small sized graphs, all frameworks perform well, hence the FPS performance reaches the nominal limit of 60 FPS. For larger graphs, GraphWaGu shows better performance compared to other frameworks. We report that we are able to maintain interactive rendering (≥ 10 FPS) until 100,000 nodes and 2,000,000 edges on the dedicated GPU system, while NetV.js is the only other library that maintains rendering, at 3 FPS.
在两个系统上,GraphWaGu 都优于其他框架,并且是可扩展性最强的方案。 即使使用集成 GPU,GraphWaGu 在最大规模图上的渲染性能也明显更好,如 图4 所示。 在集成 GPU 上,基于 WebGL 的库在最高节点数量之前与优化过的串行库表现相近,因为可利用的 GPU 算力并不多。 在独立 GPU 上,基于 WebGL 的库表现好得多,Stardust 在超过 10,000 个节点和 200,000 条边之前,与 GraphWaGu 保持大致相同的 FPS,而这也是 Stardust 图渲染的极限。 对于小规模图,所有框架表现都很好,因此 FPS 性能达到 60 FPS 的名义上限。 对于更大的图,GraphWaGu 相比其他框架表现更好。 作者报告称,在独立 GPU 系统上,GraphWaGu 能够在 100,000 个节点和 2,000,000 条边之前保持交互式渲染(≥ 10 FPS),而 NetV.js 是唯一还能继续渲染的其他库,但仅有 3 FPS。
4.3. Layout Computation Benchmarks
In this section, we evaluate the efficacy of GraphWaGu FR and GraphWaGu BH layout computation functionality. Because technologies like Stardust and NetV.js support only rendering while relying on other libraries to create graph layouts, we evaluate our system only against D3.js’s D3-force layout computation ability. This library utilizes a Barnes-Hut approximation of repulsive forces, so that each iteration of its algorithm is
本节评估 GraphWaGu FR 和 GraphWaGu BH 的布局计算功能。 由于 Stardust 和 NetV.js 这类技术只支持渲染,并依赖其他库创建图布局,作者只将系统与 D3.js 的 D3-force 布局计算能力进行比较。 该库使用 Barnes-Hut 近似计算排斥力,因此算法每次迭代为
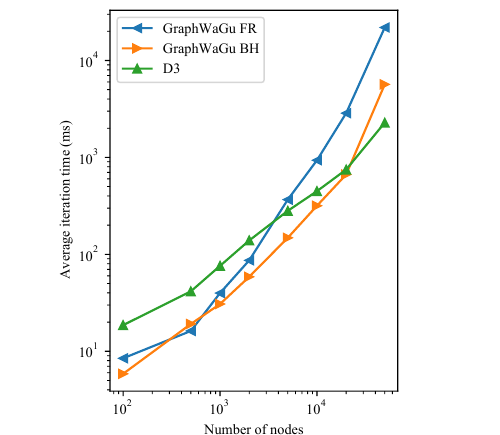
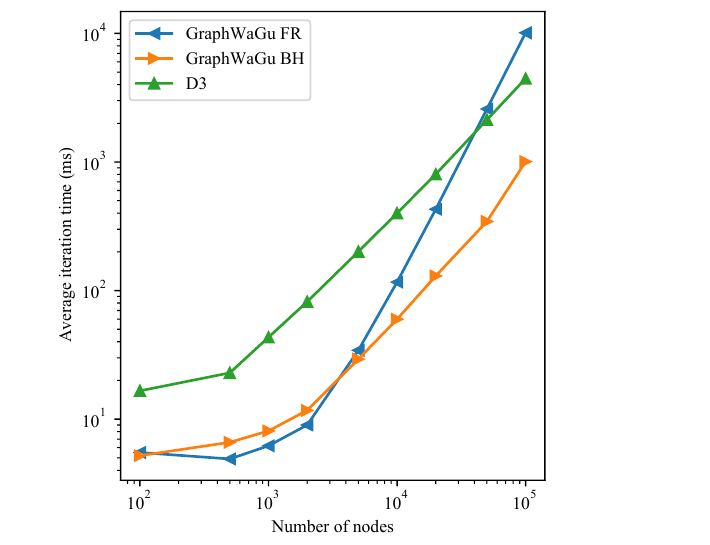
Figure 5 shows the results for the integrated GPU. We observe that GraphWaGu FR yields the best performance for graphs with relatively fewer number of nodes, however, D3-force outperforms GraphWaGu algorithms for graphs with larger number of nodes. This is because the low computational benefit offered by the low-end dedicated GPU does not offset the additional cost of creating and running the compute pipelines for GraphWaGu BH here. Figure 6 shows the results for the dedicated GPU. For the largest graphs, GraphWaGu BH has the best iteration time, although it grows at the same rate as D3-force iteration time as both have
图5展示了集成 GPU 上的结果。 作者观察到,对于节点数相对较少的图,GraphWaGu FR 性能最佳;然而对于节点数更大的图,D3-force 优于 GraphWaGu 算法。 这是因为低端集成 GPU 提供的计算收益不足以抵消创建和运行 GraphWaGu BH compute pipeline 的额外开销。 图6展示了独立 GPU 上的结果。 对于最大的图,GraphWaGu BH 具有最佳迭代时间;不过它与 D3-force 的迭代时间以相同速率增长,因为二者都具有
4.4. Layout Quality Evaluation
In order to accurately measure the performance of the different layout creation algorithms, a comparison must be made on the quality of outputted graphs. There are many aesthetic metrics available which seek to quantitatively evaluate different ideal features in a 2-dimensional graph. For the sake of this paper, we have chosen the following three metrics to verify the quality of graphs outputted by D3, GraphWaGu FR, and GraphWaGu BH.
为了准确衡量不同布局生成算法的性能,必须比较输出图的质量。 已有许多美学指标用于定量评估二维图中的不同理想特征。 在本文中,作者选择以下三种指标来验证 D3、GraphWaGu FR 和 GraphWaGu BH 输出图的质量。
Edge Uniformity is a measure of the variance of a layout’s edge lengths. We calculate this measure as the normalized standard deviation of edge length:
边均匀性(Edge Uniformity, EU)衡量布局中边长的方差。 作者将其计算为边长的归一化标准差:
Because a higher value corresponds to greater standard deviation among edge lengths, a lower value of EU is a better aesthetic measure for a layout. Stress measures the difference between the input graph theoretical distances and output realized 2-dimensional distances for each pair of vertices in a layout. A lower value of stress corresponds to a better layout as it means depicting the input graph more accurately. Neighborhood Preservation evaluates the precision of a layout in maintaining the proximity of nodes when translating from graph space to 2-dimensional space. A higher value of NP means a better layout, with a value of 1 meaning that all vertices preserve all their neighbors.
由于较高数值对应边长标准差更大,因此 EU 越低,布局美学质量越好。 Stress 衡量布局中每一对顶点的输入图理论距离与输出二维距离之间的差异。 Stress 越低,说明布局越能准确描绘输入图,因此布局越好。 邻域保持度(Neighborhood Preservation, NP)评估从图空间转换到二维空间时,布局保持节点邻近关系的精度。 NP 越高表示布局越好,数值为 1 表示所有顶点都保留了全部邻居。
| Graph | Quality metric | ||||||||
|---|---|---|---|---|---|---|---|---|---|
| D3-EU | FR-EU | BH-EU | D3-S | FR-S | BH-S | D3-NP | FR-NP | BH-NP | |
| Pkustk01 | 8.3E-01 | 8.3E-01 | 7.7E-01 | 3.0E+07 | 3.6E+07 | 2.5E+07 | 4.4E-01 | 4.3E-01 | 4.4E-01 |
| Pkustk02 | 8.1E-01 | 7.3E-01 | 6.9E-01 | 1.3E+08 | 9.8E+07 | 1.1E+08 | 3.3E-01 | 3.4E-01 | 3.3E-01 |
| Finance_256 | 1.3E+00 | 9.2E-01 | 8.8E-01 | 3.9E+08 | 3.2E+08 | 3.7E+08 | 3.4E-02 | 4.8E-02 | 1.8E-02 |
| ba_network | 1.1E+00 | 1.6E+00 | 1.1E+00 | 9.1E+06 | 7.3E+06 | 7.9E+06 | 2.9E-02 | 7.4E-02 | 3.6E-02 |
| Fe_4elt2 | 4.8E-01 | 6.3E-01 | 4.5E-01 | 4.2E+07 | 2.7E+07 | 2.5E+07 | 1.3E-01 | 1.8E-01 | 1.0E-01 |
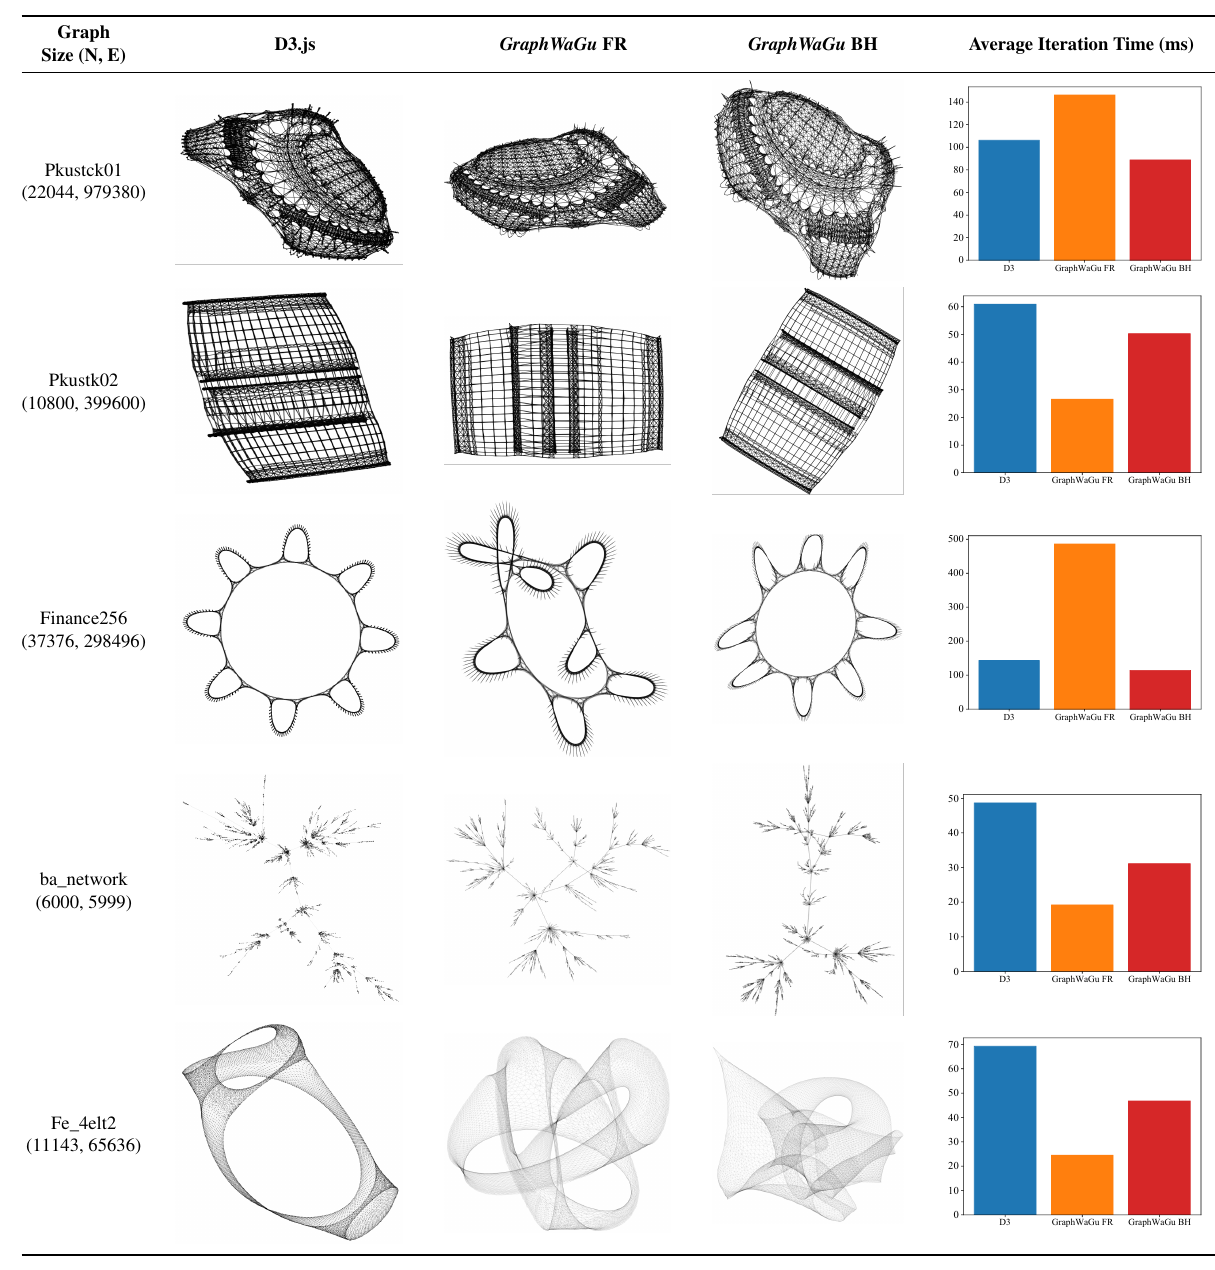
As shown in Table 1, we compute the layout of five real graphs from the SuiteSparse Matrix Collection in D3.js, GraphWaGu FR, and GraphWaGu BH on the dedicated GPU. To fairly compare the quality of the layouts being output, and to ensure that they would reach convergence of energy minimization, each algorithm ran for 2000 iterations for each dataset. Each layout was then rendered using GraphWaGu for consistency, and this output is shown. In terms of performance, we observe the same behaviour experienced in our benchmarks, where GraphWaGu outperforms D3.js for small graphs with both approaches and large graphs with the BH approach. Because of this, we compute the quality metrics described above to judge quantitatively the aesthetic standard of all the layouts, and depict the results in Table 2. For edge uniformity, GraphWaGu BH is the winner for all 5 graphs. For both stress and neighborhood preservation, either GraphWaGu FR or GraphWaGu BH has the best score for all datasets, although D3 is comparable for most. Overall, these results point that GraphWaGu creates layouts of equal or better quality then D3 when using both the FR and BH algorithms.
如 表1 所示,作者在独立 GPU 上使用 D3.js、GraphWaGu FR 和 GraphWaGu BH 为 SuiteSparse Matrix Collection 中的五个真实图计算布局。 为了公平比较输出布局质量,并确保它们达到能量最小化收敛,每种算法在每个数据集上都运行 2000 次迭代。 为保持一致,每个布局随后都使用 GraphWaGu 渲染,表中展示了这些输出。 在性能方面,作者观察到与 benchmark 相同的行为:对于小图,GraphWaGu 的两种方法都优于 D3.js;对于大图,BH 方法优于 D3.js。 因此,作者计算上述质量指标,以定量判断所有布局的美学标准,并在 表2 中展示结果。 对于边均匀性,GraphWaGu BH 在 5 个图上全部胜出。 对于 stress 和邻域保持度,GraphWaGu FR 或 GraphWaGu BH 在所有数据集上都取得最佳分数,尽管 D3 在多数情况下也具有可比性。 总体而言,这些结果表明,在使用 FR 和 BH 算法时,GraphWaGu 可以生成质量等于或优于 D3 的布局。
5. Conclusions
We have presented GraphWaGu, the first WebGPU based graph visualization tool that enables parallel layout computation and rendering for large scale graphs in the browser. We have implemented a WebGPU based layout computation for both Frutcherman-Reingold and Barnes-Hut algorithms. Performance scaling studies have demonstrated that GraphWaGu can achieve the best performance for both small graphs and large graphs when compared with existing state-of-the-art web based visualization libraries. The layout computation and rendering performance of GraphWaGu pave the way for a new generation of web-based graph visualization tools that leverage the full power of the GPU.
作者提出了 GraphWaGu,这是第一个基于 WebGPU 的图可视化工具,使浏览器中大规模图的并行布局计算和渲染成为可能。 作者实现了基于 WebGPU 的 Frutcherman-Reingold 和 Barnes-Hut 两种算法的布局计算。 性能扩展实验表明,与现有先进 Web 可视化库相比,GraphWaGu 在小图和大图上都能取得最佳性能。 GraphWaGu 的布局计算与渲染性能,为新一代基于 Web、能够充分利用 GPU 完整能力的图可视化工具铺平了道路。